Product Positioning
The Material Management System is a comprehensive material statistics software deeply integrated with PDMS/E3D. It breaks the fixed-template limitation of traditional software, letting you extract node properties as needed and use the built-in PML expression engine for complex mathematical operations and logical filtering. Whether it is equipment, structures, fittings, bolts, insulation and painting, or supports and hangers, the system captures data accurately and generates customized material reports that meet company standards with one click.
PML expressions and deep property extraction
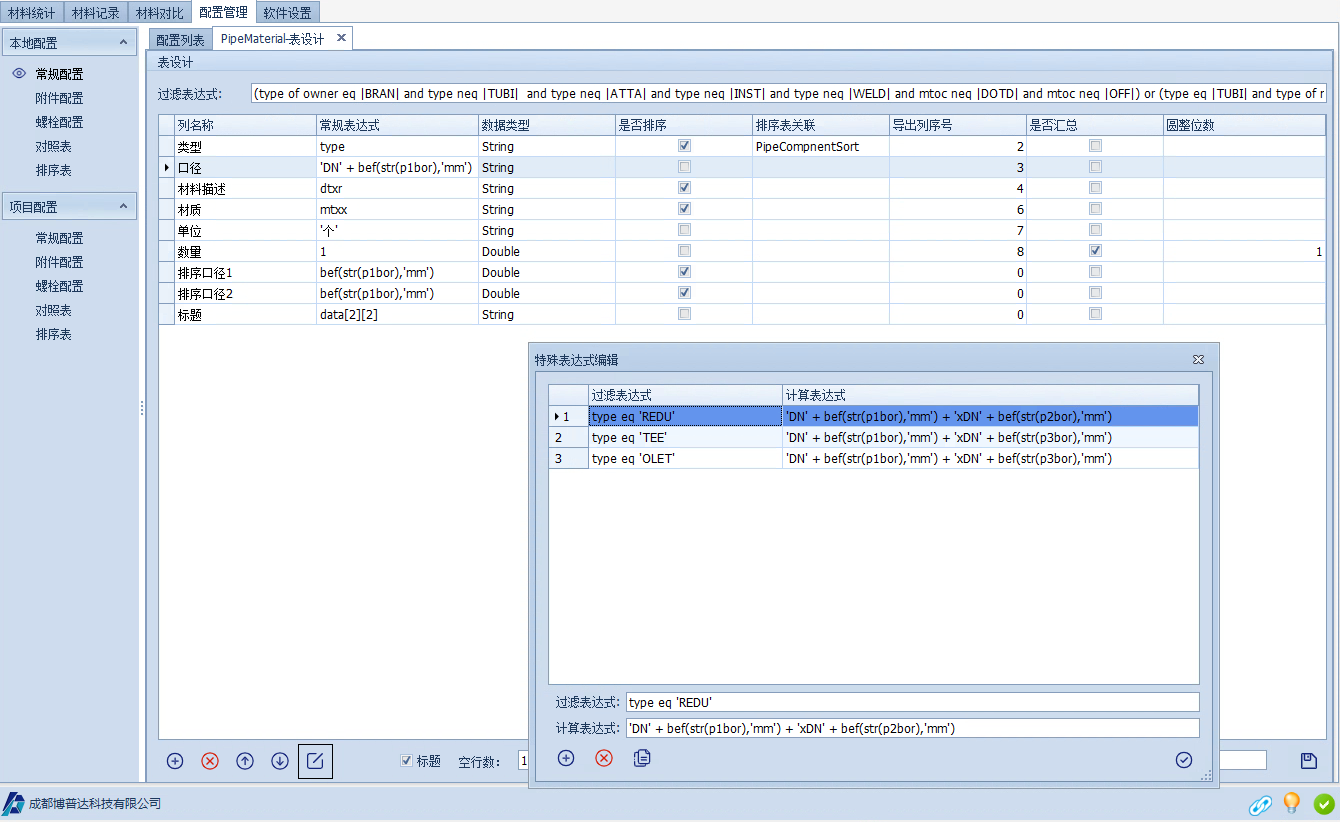
The system provides a rich set of general and special expression configurations. You can target an element's low-level properties (such as P1BOR, mtxx) for string concatenation, numeric extraction (such as nominal diameter DN) and even intelligent recognition and calculation of multiple diameters for reducing fittings (such as REDU, TEE, OLET). Data type conversion and decimal rounding are supported to meet the strictest accuracy requirements.
Multi-dimensional material classification and refined management
Fittings/equipment: lookup tables such as data[3][2] automatically classify fittings into major categories such as “pipes, fittings, flanges, valves”.
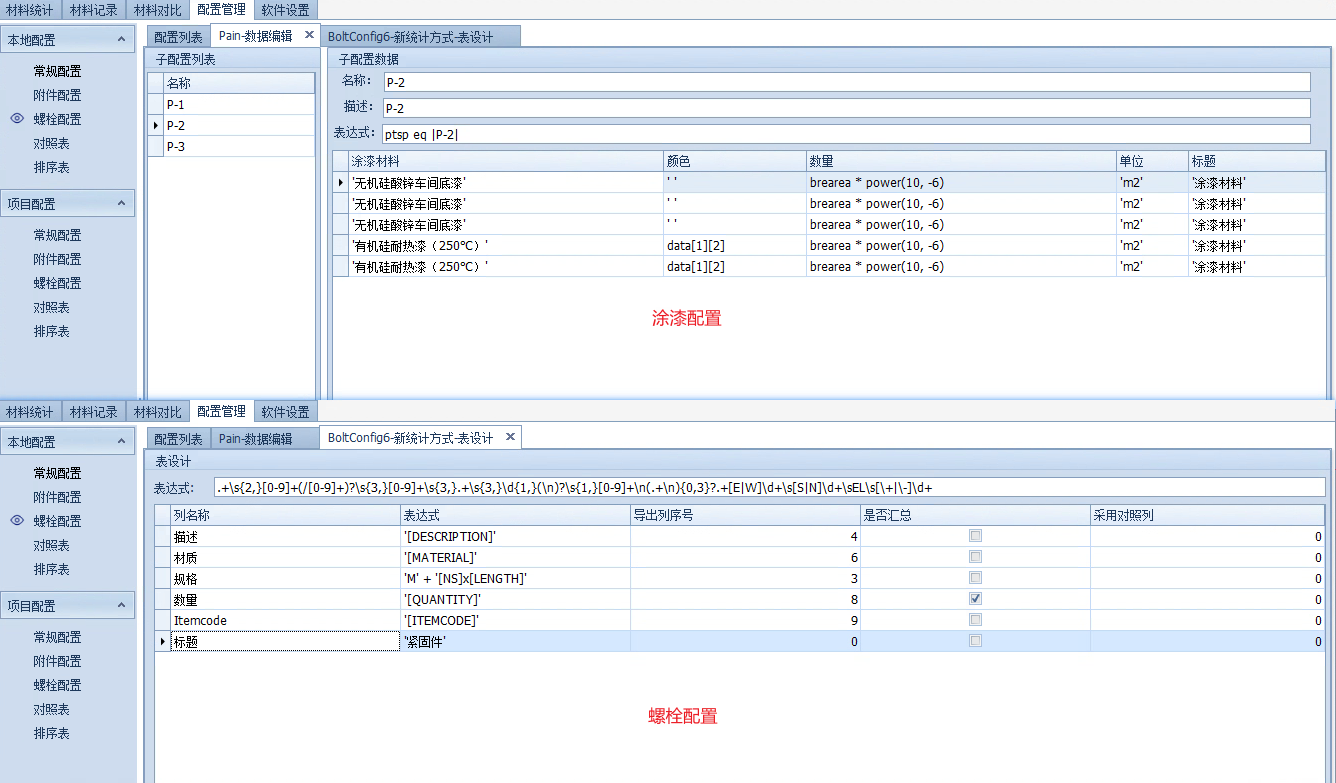
Painting/insulation: attachment configuration is supported; paint and insulation quantities are calculated accurately from expressions combining area (brearea) and thickness.
Bolts: dedicated regular expressions and keywords (such as [NS], [LENGTH]) parse bolt descriptions automatically and generate bolt reports that comply with the Isodraft standard.
Highly flexible report formats and sort rules
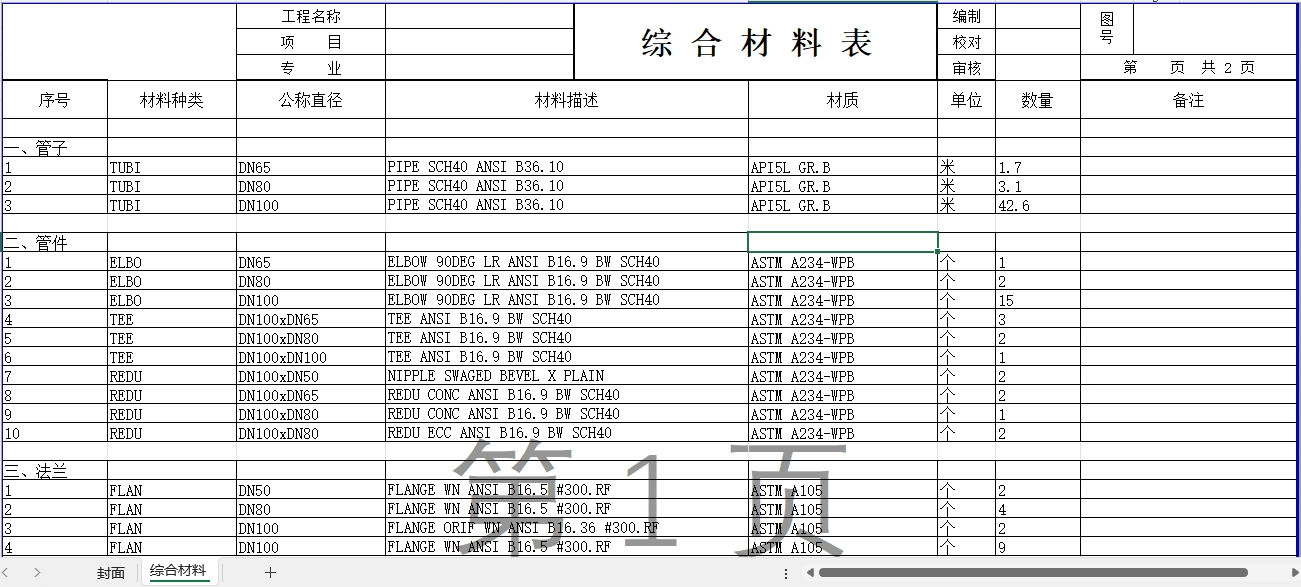
No more messy raw data. The system can use Excel template files you have prepared, filling in data accurately by setting “Start Row” and “Export Column Index”. It also offers both “direct sorting” and “sort table linking”, so you can define the priority of material categories (for example: pipes -> fittings -> flanges) and even add “header” rows and blank rows to generate a standard Piping Material Summary with category headers automatically.
Version snapshots and one-click difference comparison
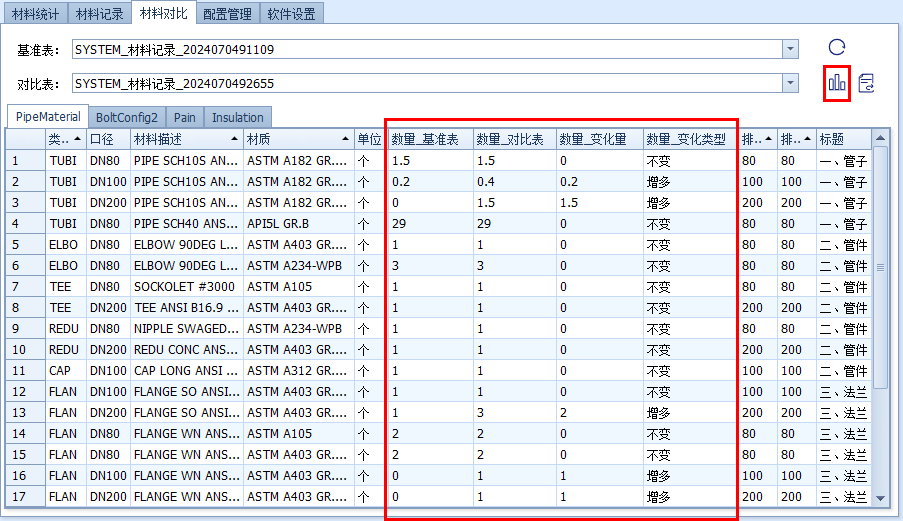
You can save each statistics result as a history record (snapshot). After a design change, select a “base table” and a “comparison table” to generate a difference report with one click. The system automatically calculates the original quantity, new quantity, quantity difference and the change type (increased/decreased/unchanged).